Kicking ability in the NFL
Since I started watching American football just over a decade ago the NFL kicker has always been something of an enigma. These guys are hardly ever analysed in any depth on TV and are only on the field a few times a game yet they can earn serious money. A few weeks ago the Houston Texans signed their kicker Kaimi Fairbairn to an extension worth just under $4.5m per year (4year, 9m guaranteed according to Over the Cap). Fairbairn has only played 3 seasons but is now earning about 8 times what he was earning in his rookie year. He seems to be well liked in Houston (he’s made some memorable kicks) but is he really worth such a lucrative contract? I wanted to learn a bit more about NFL kickers, how they can be rated and how confident we can be in their performance.
Note: Only regular season field goals are used in this analysis
Points over Expected (POE)
If you head over to ESPN the main stats used to describe kickers are FGM (field goals made) and FG% (field goals made / field goals attempted). The issue with these stats are that not all field goals are created equal. If you are constantly asked to hit 50+ yard field goals your FG% is going to be lower than someone who is only kicking from 20 yards, even if you are the better kicker. Inspired by this tweet (and subsequent thread) I started to look into how kickers do relative to their expected return.
THREAD
— Moo (@PFF_Moo) September 17, 2018
The importance of kickers is overrated in the public perception and here is why: We all agree that kickers around the NFL had a very bad overall performance yesterday. Using #nflscrapR data from 2009-2017 and a loess model, one can assign a probability to each field goal. pic.twitter.com/P8ynFvOgKU
For every field goal we can calculate the expected points and then compare that to the actual points gained. Each field goal is worth 3 points so it can be calculated as:
$expected\ points\ =\ P(success)\ * 3$
$actual\ points\ =\ success\ * 3$
$POE\ =\ actual\ points\ /\ expected\ points$
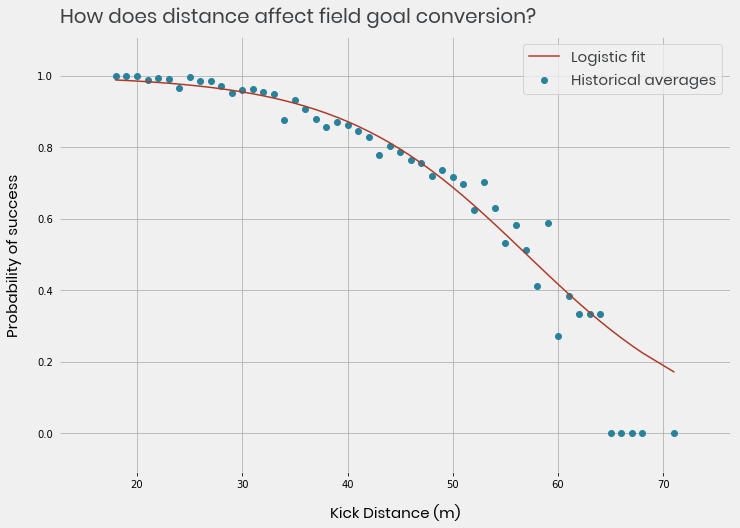
To get the probability of success for each kick we can fit a logistic regression on field goal data with distance as a variable. The model is trained on over 10,000 field goals going back to 2009 using data from NFLScrapR.
The chart below shows the results of the logistic fit, plotted alongside it are the raw historical averages at each distance. The model fits the average rates quite well except for at very long distances but only 8 kicks of 65 yards or more were attempted in 10 years and they were all missed. Similarly to the point made in the thread above, the likelihood from this model is arguably too high for long distance kicks, these will tend to only be attempted by the better kickers. If everyone attempted them there would be even more failed attempts and so a reduced probability of success.
This metric is extremely correlated with FG% but it gives us information about the kick. If a guy makes 100% of his field goals, all from from 20 yards, he is only going to look slightly better better than average. If a guy kicks 90% all from 50+ yards, he is going to look a lot better than average.
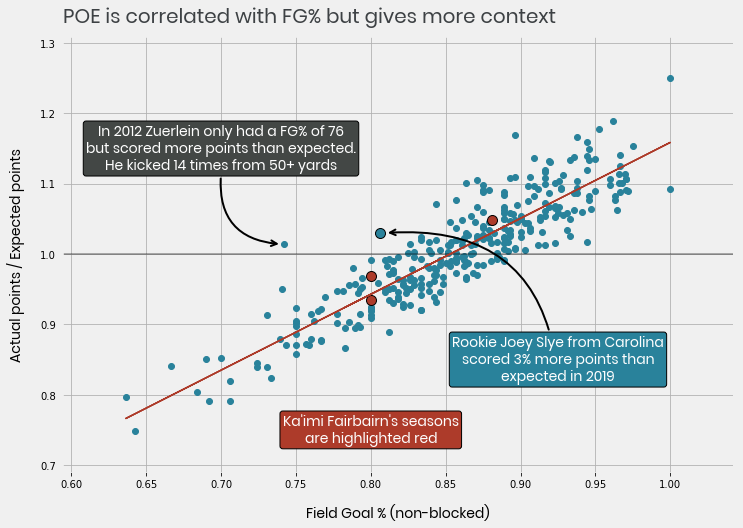
I’ve highlighted Fairbairn’s seasons; he’s not really setting the world on fire! Kicking above average only once, his 2017, 2018 and 2019 points over expected (POE) are 0.93, 1.05, 0.97 respectively. The Panthers rookie Joey Slye kicked 3% more points than expected from his 31 attempts in his rookie season, a POE of 1.03. As Slye has a better average, does that make him a better kicker? Slye’s only had 31 career kicks, while Fairbairn has had over 90, how likely is it that he continues at that level? Are we confident that is his true level, or did he maybe get a bit lucky? We can use Empirical Bayes to help us answer these questions by estimating a players ‘true POE’ score, and our confidence in that estimate.
Empirical Bayes kickers
When a new kicker comes into the NFL we update our estimate of how good they are after every kick. If a kicker hits his first 20 Field Goals you’re probably going to think he is a bit better than you did before. If he misses the next 100 you’re going to think he is worse. Bayesian methods do a similar thing. We start with a prior belief about something, communicated in the form of a probability distribution. As new information is gathered we update our belief, and so the distribution changes. The output is a probabilistic distribution of your estimate. The centre of the distribution is your best estimate of a players ability. If the distribution is narrow it means you are confident in the estimate, if its wide it’s uncertain.
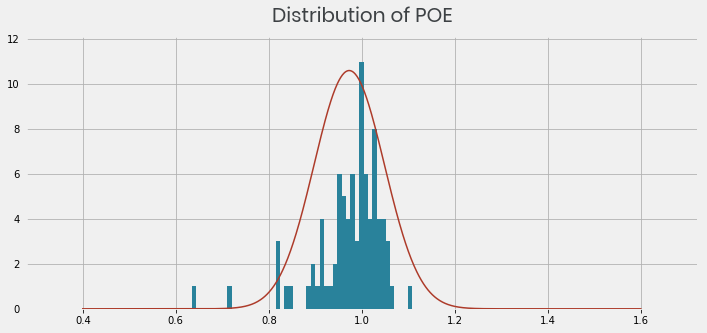
With Empirical Bayes, our prior belief comes from the data. In the chart below we plot the distribution of POE scores across every kicker in the dataset with over 10 Field Goals attempted. This gives us our prior distribution.
Now we have our prior estimate we can update it using the observed POEs from each player and the number of field goals they have attempted, this updated estimate is called the posterior. Below is a plot that shows how our opinion of Joey Slye would change based on the number of kicks he’s attempted.
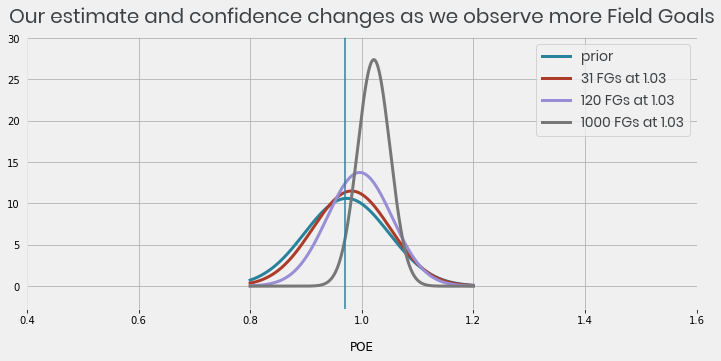
Before we have seen any of Slye’s kicks we would have used the prior to estimate his ability. After 31 kicks at 1.03 POE we can see that the distribution has moved ever so slightly to the right, we’ve nudged our best estimate of Slye’s ability to be slightly better than average but it’s still quite uncertain. If Slye had scored 1.03 from 1000 kicks our best estimate of his ability would be even better and we would be more confident in it.Below we plot the posterior distribution for each kicker active in 2019.
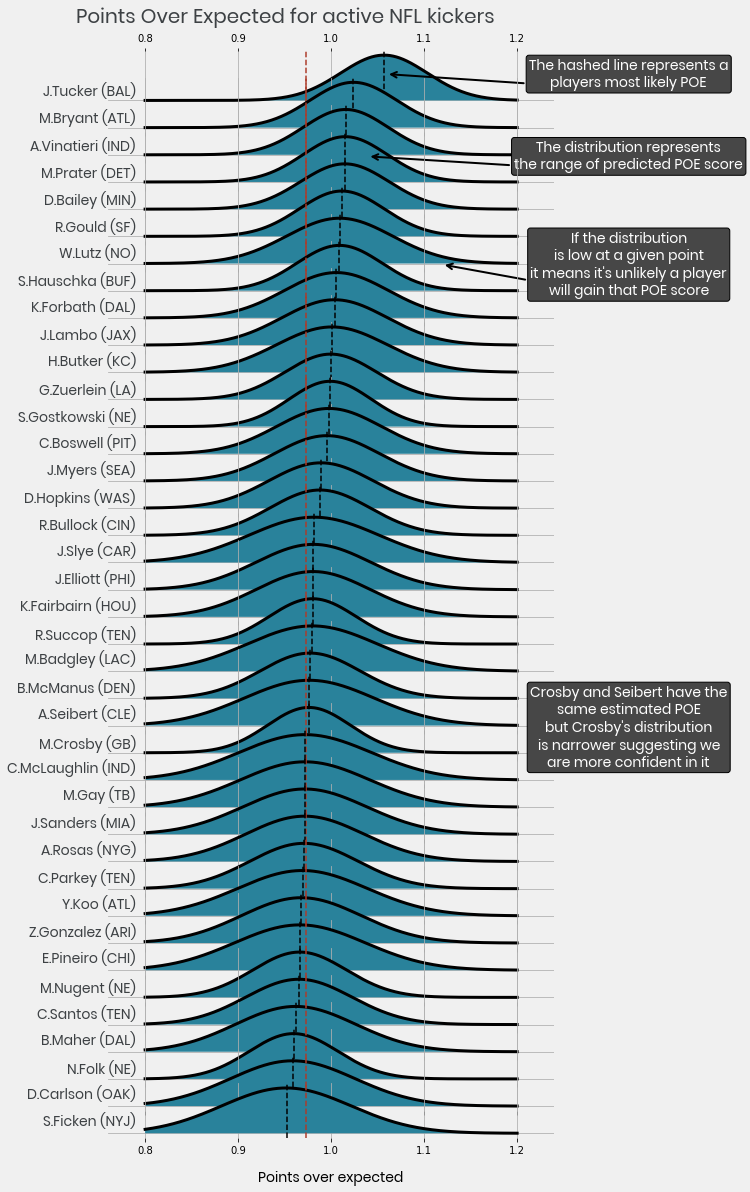
Justin Tucker is far and away the best kicker in the NFL. Our best estimate is that he kicks at 1.06 POE with confidence intervals of 0.97-1.15. Tucker’s true POE is more likely to be 1.15 than a bit below average. What’s nice about this is we can use it to give us an estimate of how many points a kicker could add, along with some confidence measure.
In 2019 Houston’s Field Goals were worth 61.95 expected points, lets assume they get the same next year. Our ratings suggest that Ka’imi Fairbairn would score on average 60.711 points with 95% confidence intervals (CIs) of 53.3-68.1. We estimate Justin Tucker would score 65 points with CIs of 59.7-71.1 from the same kicks. The weakest active kicker is Sam Ficken of the Jets who is estimated to make 58.85 points on average (50-67). Although the range of distributions are wide it suggests the 2019 Texans would only make, on average, 7 more points per season by having the best kicker in the game vs the worst.
Even if variance is on Fairbairn’s side and he hits his upper CI and becomes the best kicker to ever live, he’s only worth 10 more points per season vs the worst (on average), and the chance of that happening is slim. He has more chance of scoring lower than Ficken’s current average. The Fairbairn contract seemed like a mystery before I started this but now I’m scratching my head even more.
Notes on method
- The expected success model assumes home field advantage, stadium type and weather have no bearing on the outcome of the kick, which is obviously false. Improvements could be made there but I’ll be damned if I am going to make them.
- To update the prior distribution I converted the POE to a binomial probability. Have a look at David Robinsons Introduction to Empirical Bayes book.
- For the ridgeplot I used Peter McKeever’s blogpost on creating ridgeplots
- I’ll aim to get the notebook up behind this analysis at some point once I’ve tidied it all up, I’ll post it here.